Agile metrics are a crucial part of an agile software development process. They help software teams monitor productivity across workflow stages, access software quality, as well as introduce more clarity to the development process. Metrics in agile software development can also help a scrum/kanban master keep track of their teams’ well-being.
For our list, we have chosen scrum and kanban metrics that can be useful to both in-house agile teams and agile dedicated teams in measuring software quality, productivity, performance/well-being, as well as general project metrics. We will also take a look at lean kanban metrics and how to ensure your product ends up with clean code in two separate sections.
Let’s start.
Types of Agile Metrics
There are three main types of agile metrics:
- Scrum metrics. The most commonly used metrics in software development.
- Kanban metrics. An agile software development framework similar to the scrum methodology.
- Lean metrics. Metrics used to streamline the manufacturing of physical products, from which both kanban and scrum originate.
Agile Quality Metrics
This group of agile software development metrics will help you assess the quality of your software product and predict whether the target audience will like it.
Escaped Defects
Escaped Defects will help you identify the number of bugs in a build or release after in enters production. This metric allows your team to access the quality of your software, although in a rather raw form. This is one of the agile quality metrics you should consider using: bugs on production always pose problems.
Failed Deployments
This metric will help you access the number of deployments to testing and production environments. Failed deployments can shed light on how reliable those environments are and whether a team is building working software at all. Concurrently, you can use the the failed deployments metrics to understand whether a given sprint or release is ready to go to production. As far as quality metrics in agile software development go, failed deployments is incredibly useful.
Release Net Promoter Score (NPS)
NPS measures the reaction of users to a given release. The metric can help teams predict whether users will recommend the software product. Net Promoter Score is measured right before the release. Although one of agile software quality metrics on our list, NPS can also be regarded as a customer satisfaction metric.
Agile Productivity Metrics
The following selection of agile development metrics will help you assess your team’s productivity in completing stories, tasks, and bigger bodies of work. The many useful agile productivity metrics will also aid you in predicting the productivity of your team in forthcoming sprints, prevent bottlenecks, and tackle unexpected scope changes.
Lead Time
Lead Time allows for monitoring a story from the point when it enters a backlog to a sprint’s end (or to the moment of release). The lower it is, the more effective your development process is. Lead Time is one of those agile metrics that allows for gaining an overarching perspective on the productivity of your development efforts.
Cycle Time (Control Chart)
Part of the previous metric, Cycle Time will help you measure the average time your team needs to fulfill a task. If your team has short cycle times, it means they are highly effective. Concurrently, when your team’s cycle team is consistent, you can better predict how they will work in the future. This metric will also help you to quickly pinpoint the emerging bottlenecks in your agile software development process.
Sprint Burndown
Before starting a sprint, a team forecasts how many story points they can complete in its course. Sprint Burndown allows a scrum/kanban master to track the completion of those story points and ensure a team will finish the planned scope of work within the set time frame.
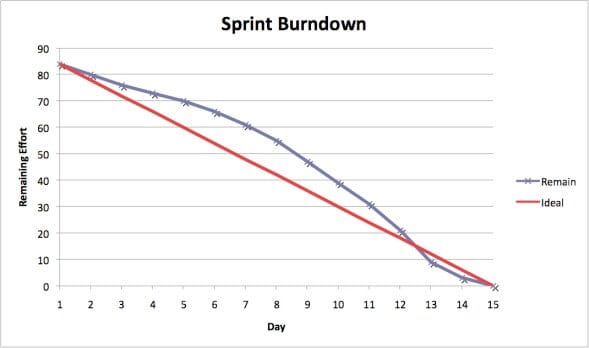
Sprint Burndown chart example (Source: Scrum Institute)
Sprint Burndown is one of the most effective agile productivity metrics for a few more reasons. First, it allows you to track the progress of a sprint closely and in real time. Second, the metric shows how agile your team really is.
Epic & Release Burndown
These metrics allow teams to track bigger bodies of work than Sprint Burndown can cover. One of the major benefits of Epic Burndown and Release Burndown is that they help to manage the scope creep — the addition of new requirements after the project scope was already defined. These agile metrics will help you ensure your team will not lose in productivity after, for example, the product owner on the client’s side tasks your team to add a new massive feature.
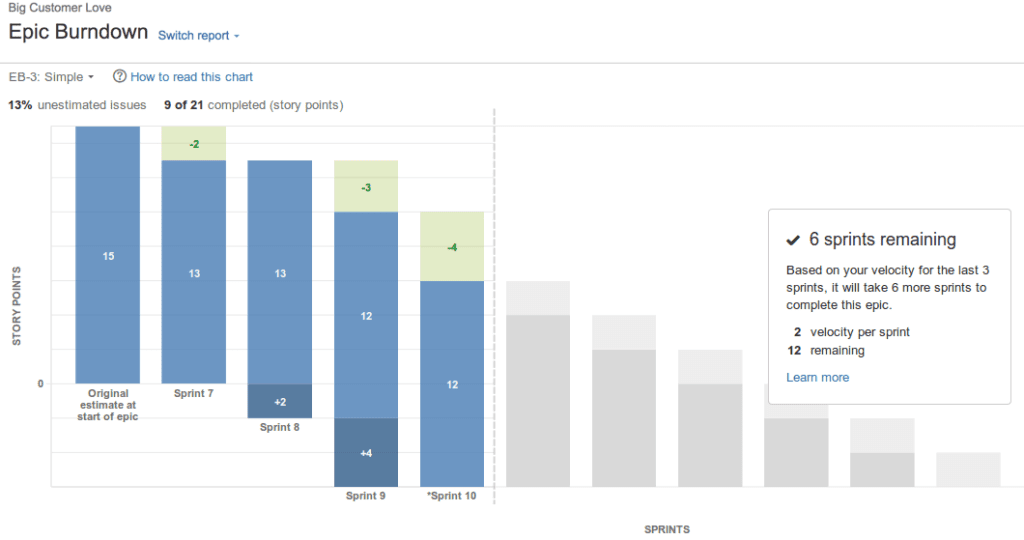
Epic Burndown chart example (Source: Atlassian)
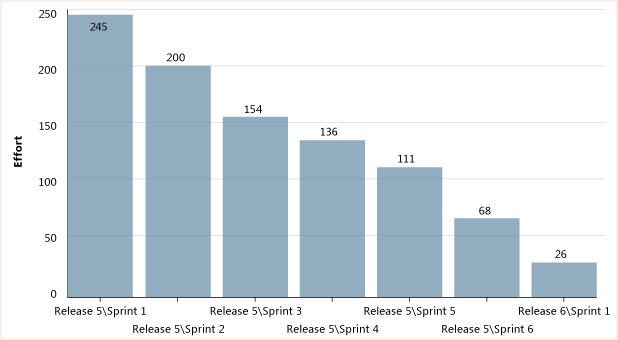
Release Burndown chart example (Source: Atlassian)
Velocity
Velocity is one of the most essential metrics in agile software development, allowing you to assess the average quantity of completed story points over several past sprints. You can use the metric to foresee how effective your team will be in the forthcoming sprints, making it a rather powerful planning tool.
The benefits of Velocity also include:
- Easy to measure
- Shows a clear result right away
- Lower Velocity may signal about emerging sprint inefficiencies
As many factors can affect productivity, it is crucial to follow how your team’s Velocity changes over time.
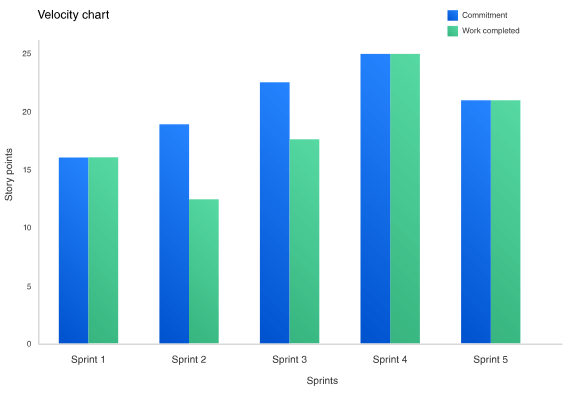
Velocity chart example (Source: Atlassian)
Agile Project Metrics
A handy addition to the metrics above, agile software project metrics will provide actionable information on your development processes, helping to your team to avoid issues both big and small.
Cumulative Flow
Cumulative Flow is arguably one of the most powerful agile project metrics for kanban. It gives you a bird’s-eye view on the statuses of your tasks in a sprint, release, and across software teams. With this metric, you will be able to view all statuses for all workflow stages and immediately identify bottlenecks — all in a single diagram.
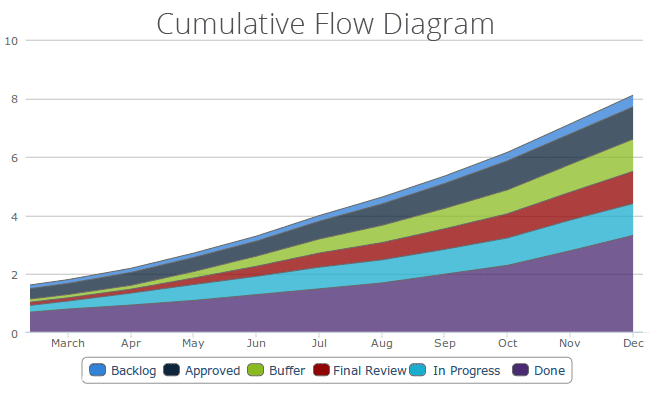
Cumulative Flow Diagram example (Source: Kanban Tool)
Code Coverage
Code Coverage will help you calculate how much of your product’s code is covered by unit tests, presenting it in a raw visualization. It can be measured by the quantity of methods, conditions, statements, and branches that comprise your unit testing suite. You can also run Code Coverage automatically as part of every build.
While Code Coverage is one of the most effective agile metrics, it does not measure the input of other types of testing. So, if your numbers are high, it doesn’t necessarily mean your product has solid code. Still, the metric will give you a good perspective on the quality of your product.
Health Metrics for Agile Teams/Agile Performance Metrics
While most agile software development metrics are aimed at assessing software quality and team productivity at different stages and from different perspectives, monitoring the well-being of your team is as crucial.
Happiness
There is no single, tried-and-true way to measure happiness in a software development team. Still, a common solution is to ask every team member to rate current happiness on a scale from 1 to 5. According to organizational psychologist Christiaan Verwijs, this can be followed by several questions, for example:
- How happy are you with your company? (on a scale from 1 to 5)
- What feels best right now? (open question)
- What feels worst right now? (open question)
- What would increase your happiness? (open question)
Team Morale
Still, Verwijs argues that measuring morale in an agile software development team is more effective. The Happiness metric can be unreliable due to its subjectivity and measuring it entails many nuances that don’t help in solving the problem. Team Morale, on the other hand, offers a more subtle approach that accounts for mood swings.
So, Verwijs suggests to measure Team Morale by asking team members to rate the following statements on the scale from 1 to 5 (or from 1 to 7, for more nuanced results):
- I feel fit and strong in my team
- I am proud of the work that I do for my team
- I am enthusiastic about the work that I do for my team
- I find the work that I do for my team of meaning and purpose
The questions are more specific, allowing you to better access the well-being of your team members.
Still, approaching and accessing such aspects is a complicated matter. It is up to a scrum/kanban master to choose the one that fits best (they can also propose a different approach altogether). If you doubt whether you need to use these metrics for agile teams, try starting small by measuring happiness monthly, and see how it goes. Agile team performance metrics might just be what you need to improve your development process.
Core Lean & Kanban Metrics
Now, let’s explore the key metrics in lean and kanban methodologies. These metrics are often common to both software development and goods manufacturing.
Story Lead Time
Story Lead Time (SLT) is the analogue of the Lead Time metric used in agile software development. SLT helps you measure how much time has passed from the moment a user story entered a backlog to the point when it is completed. That includes the time the story was simply sitting in your backlog. The main aim of SLT is to help teams assess and reduce the speed of a value chain.
Not only that, but the metric may also prompt your team to gain speed if your value chain has slow cycles: the amount of sitting is added to the overall SLT. If a story had been sitting in a backlog for two months and then was completed in two weeks, the SLT will be two and a half months.
Story Cycle Time
Story Cycle Time (SCT) is a metric that is part of Story Lead Time. It covers only the time a story is in progress, helping to measure and reduce the hours spent on it. Story Cycle Time is always shorter than Story Lead Time and takes up half of a sprint or less. If a story goes from one phase to another, for example from development to testing, you should count in that time as well.
Feature Lead Time
User stories often form features, and measuring how much time does it take to create and release a feature is also important. This is the aim of Feature Lead Time (FLT), the analogue of Story Lead Time for features. Like the latter, FLT covers the time between the moment a feature has entered a backlog and the point when it is released to customers. The countdown begins when the first user story for a feature enters a backlog.
Feature Cycle Time
This is the equivalent of Story Cycle Time, but for features. The aim is the same: Feature Cycle Time will let you know for how many hours a feature was in progress without counting in the sitting time. The clock on FCT starts ticking when the first user story of a feature is sent to the development phase.
Story Wait Time
Story Wait Time (SWT) helps you measure the sitting time of task, and is also part of the Story Lead Time. Every team should reduce SWT as much as possible.
Story Throughput
Story Throughput (ST) is similar to Sprint Velocity and helps to count the number of stories finished in a sprint. ST is easy to measure and encourages smaller stories. With this metric, stories should be included into the sprint they were completed, not started in.
Story Throughput is a highly useful metric. If all your stories are similar in size, you can use ST instead of Velocity. If your stories have a normal distribution (one part of your stories has a specific average size, and the other part goes below and above that average), you can also use ST instead of Sprint Burndown and Sprint Burnup.
Created-to-Finished Ratio
If you see that too many items are going back to backlog and few are finished, this metric may prove useful to access bottlenecks and the overall progress of your team. Early on in the project, the ratio can be high, but it is a rather common scenario. When a product is being shaped, your team members test different ideas and create stories for them. Expectedly, many of those ideas will not prove viable (or simply give birth to new, more effective ones). Still, Created-to-Finished Ratio needs to gradually go down over time. If it doesn’t, there are setbacks in your development process or issues with some of the team members.
Measuring Software Quality in Agile
Today, customer demand prompts companies to deliver and update their software products faster. This means frequent changes to source code that can lead to both small and big defects. Although agile helps teams streamline the software development process, it is inseparable from security. While you will use metrics like Code Coverage, it is also important to assess code quality. As a result, conducting a comprehensive code analysis becomes crucial alongside using agile metrics.
There are two types of code analysis and one more comprehensive approach that can help teams streamline their quality assurance across projects. Let’s explore them below.
Static Code Analysis
Static code analysis lets you inspect the source code without running the software. It will help you detect bugs, security soft spots, and various shortcomings early on in the project, allowing your team to build a product with clean code. Your QA experts can also automate or semi-automate the process with dedicated tools, most of which are available for free online.
Dynamic Code Analysis
Dynamic code analysis is the opposite, and lets you evaluate code quality of running software to see how it really works. Although static code analysis plays a bigger role, dynamic code analysis allows QA experts detect issues that arise when different elements of software communicate with each other. Still, it doesn’t mean that dynamic code analysis can be skipped — you should use it alongside its counterpart.
Quality Intelligence
Often, code analysis is not enough. In a time when software needs to be delivered and updated quickly, you may want to make a comprehensive assessment to pinpoint soft spots in your development process related to quality assurance, and streamline your software delivery further. Quality intelligence tools provide a solution by helping teams gather data from across the entire software development lifecycle, analyze this data, and use it to improve their quality assurance workflows.
What Are the Key Agile Software Development Metrics?
Our selection includes agile software development metrics that will aid you in delivering quality software on time while ensuring the well-being of your team members. Still, using each and every one of the metrics on out list is not a precondition for success. In the end, the choice depends on your team’s scrum/kanban master, the team, and the agile culture in your company.
Frequently Asked Questions
What is KPI in agile?
When it comes to the software development process, a Key Performance Indicator (KPI) is any agile metric. Although the concept of KPI may be associated with rigid rules, agile software development still manages to be the most flexible approach to managing software development project as compared to the waterfall methodology.
How is velocity calculated in agile?
To calculate velocity for a project, you need to take the total number of finished story points and divide them by the number of finished sprints. If your team finished 90 stories over three sprints, its velocity will be 30 points per sprint.
What is throughput in agile metrics?
Story Throughput is one of the core metrics in the kanban framework. It helps to count the number of stories that were completed in a single sprint. It is the analogue of the Spring Velocity metric in scrum.
What is Agile Productivity?
Agile productivity may refer to how well a team performs on one agile metric or a number of them.
What does APSI in agile metrics stand for?
APSI has a wide array of meaning in different industries, but there is no such term in agile software development.
What is agile matrix?
There is a type of company structure called matrix, but there is no such thing as agile matrix in agile software development.
What is agile productivity?
Agile productivity may refer to how well a team performs on one agile metric or a number of them.